VaR projects
Section A)
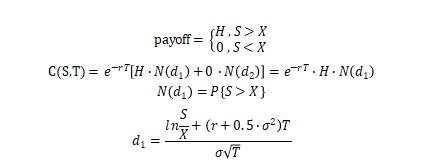
Consider the European digital option that pays a constant if the stock price is above strike price � at maturity and zero otherwise. Assuming stock price follows the following SDE under physical measure
Assuming the risk-free rate is constant �. Please write down the price of this option and explain how it is related to the price of the standard Black-Scholes European call option.
Answer:

The relationship with the price of the standard Black-Scholes European call option is that they think the same way, which both calculate the payoff first, and then find the discount.
Section B)
A bank has written a call option on one stock and a put option on another stock. For the first option the stock price is 50, the strike price is 51, the volatility is 28% per annum, and the time to maturity is 9 months. For the second option the stock price is 20, the strike price is 19, and the volatility is 25% per annum, and the time to maturity is 1 year. Neither stock pays a dividend. The risk-free rate is 6% per annum, and the correlation between stock price returns is 0.4.
1) Please derive an approximate linear relationship between the change in the portfolio value and the change in the underlying stocks, and then estimate the 10-day 99% VaR based on this relation.
Answer:
Because neither stock pays a dividend,

Bring into the digital,
The approximate linear relationship is,
![]()
Assume yield obeys geometric Brownian motion
Consider ten days VaR,![]()
Find the quantile of order 99%, which is,
![]()
2) Using C/C++ or Java or Matlab to calculate the 10-day 99% Monte Carlo Simulation based VaR for the portfolio. Set the number of simulation to 5000.
Answer:
Step0 Calculate the value of this portfolio in the beginning,
Step1 A set of random numbers [u1, d1] is generated using the function mvnrnd, which contains two returns that respectively follow the normal distribution in B-1. Based on them we can calculate the next two shares c1 and p1 . Then we generate a second random set number [u2, d2]. … and so on until the 10th day's stock price is calculated [c10, p, 10]
Step2 Use BS formula to calculate the price of the tenth day of two options, and calculate the value of the portfolio. It is noteworthy that because the stock price cannot be negative, we define the s>0.
Step3 Repeat steps 1, 2 for 5000 times, and we can get 5000 portfolio values. Sort to find the value of 99% of the sub-site, and the VaR is as following:
3) What else data is required to calculate the 10-day 99% Historical based VaR for the portfolio?
Answer:
We need have the historical data on the returns or prices of this portfolio over the past time.
Matlab code:
%calculate the price of option
c0 = 50; x1 = 51; r = 0.06; t1 = 0.75; v1 = 0.28;
[call0, put01] = blsprice(c0, x1, r, t1, v1);
p0 = 20; x2 = 19; r = 0.06; t2 = 1; v2 = 0.25;
[call02, put0] = blsprice(p0, x2, r, v2, t2);
%find the value now
portfolio0 = call0 + put0;
%Advanced Monte Carlo method
%create a series of mc
portfolio = zeros(1, 5000);
for i = 1:5000
    c = zeros(1,10);
    p = zeros(1,10);
    for j = 1:10
        mu = [0,0];
        sigma = [0.28^2 0.028 ; 0.028 0.25^2];
        s = mvnrnd(mu, sigma, 1);
        flag = 1;
        for k=1:size(s)
            if  s(k)< -1 flag = 0; break; end end if flag == 0 j =j-1; continue; end if (j==1) c(j) = c0 * (1 + s(1)); p(j) = p0 * (1 + s(2)); else c(j) = c(j - 1) * (1 + s(1)); p(j) = p(j - 1) * (1 + s(1)); flag = 1; end end call = blsprice(c(10), x1, r, t1, v1); put = blsprice(p(10), x2, r, t2, v2); portfolio(i) = call + put; end VaR = prctile(portfolio,99) - portfolio0
