Report on the performance案例
Report on the performance of Tesco, Sainsbury’s and Ocado
Report on the performance案例Report on the performance案例
Report on the performance案例 The retail industry in UK is in a volatile transition. The change of consumer behavior and the increase
Industry and company background
The retail industry in UK is in a volatile transition. The change of consumer behavior and the increase of online shopping are changing the operating mode of the industry. Sales in the UK retail industry in 2017 were £395 billion, with a gross added value of £92.8 billion. In 2018, the total volume of retail sales in the UK was 319,000 (Rhodes, 2018). Report on the performance案例
As Figure 1 shows, gross value added growth in the UK retail industry has slowed in the past three years, with a certain rebound near zero. As Figure 2 shows, every three months growth rate of the volume of retail sales in the UK has fluctuated back and forth between -2 percent and 2 percent starting in 2016 (Rhodes, 2019). The fluctuation of the retail industry is mainly due to the fluctuation of the economy, and the rise of the online shopping has also caused an impact on the retail chain.
Figure 1 Gross value added growth in the UK retail industry
Figure 2 3 mths growth rate of the volume in the UK retail industry
Report on the performance案例Report on the performance案例
Compared with the turmoil in retail chains, online retailing has maintained a growth trend for more than a decade. In 2018, the proportion of online sales in total sales exceeded 20 percent for the first time, see Figure 3. The growth in online sales has dealt a blow to retail chains, with as many as 28 retail companies closed in 2018 and 2,085 stores were affected, which is the largest number in recent years, see Figure 4 (Humphries, 2019).
Figure 3 The proportion of online sales in the UK
Figure 4 Retail companies closed in the UK
Report on the performance案例Report on the performance案例
The market share of the UK retail industry in 2018 is shown in Figure 5, and all three companies selected in the report come from the top 10 companies, namely Tesco, Sainsbury’s and Ocado. Among them, Tesco and Sainsbury’s are the top two companies in market share, while Ocado is a dedicated online retailer (Worldatlas, 2019).
Figure 5 The market share of the UK retail industry
Tesco was founded in 1919, with its headquarters in Hertford, which is the largest supermarket chain in the UK, with a market share of 27.8 percent in 2018. Tesco has now evolved into a large multinational, with its operations in 12 countries in Asia and Europe. Tesco employs about 450,000 people, has 6,800 offices and earns £639 billion. Tesco is listed on the London Stock Exchange and is a component of the FTSE 100 (Tesco, 2019).
Sainsbury’s is an older supermarket chain founded in London in 1869. For a long time, it was the largest retailer in the UK until it was overtaken by Tesco in 1995. Sainsbury’s had a market share of 15.8 percent in 2018, which is the UK’s second-largest supermarket chain only behind Tesco. Sainsbury’s has approximately 186,900 employees and 1,415 duty stations. Sainsbury’s is listed on the London Stock Exchange and is a component of the FTSE 100.
Ocado, by contrast, is a young company founded in 2000. Unlike Tesco and Sainsbury’s, Ocado does not have traditional physical retail stores, which is a complete online supermarket. Ocado’s market share was 1.4 percent in 2018, ranking tenth in the industry. Ocado is listed on the London Stock Exchange and is a component of the FTSE 100 (Ocado, 2018).
Non-financial analysis Report on the performance案例
Diversification and globalization strategy have brought strong impetus to the growth of Tesco. At present, in addition to retail chains, the company is also engaged in finance, gasoline, clothing and other businesses. Diversified business strategy has improved the company’s ability to deal with risks. At the same time, the company has expanded its business to more than 12 countries, which is conducive to the company’s continuous access to new markets (Dimitrova, Smith & Kim, 2018).
Tesco has also set up online stores in the trend of online shopping.
The development direction of e-commerce also ensures that the company will not be affected by the loss of physical store consumers. The company also provides club cards to consumers, which helps to improve consumer loyalty, and to have a more comprehensive understanding of consumer needs by collecting consumer shopping information.
Tesco also attaches great importance to the social image, who advocates reducing the use of plastic bags in order to protect the environment, and promises to achieve zero carbon emissions by 2050, which is very important for the company to establish a good image among consumers. The problem that Tesco should pay attention to is the influence of excessive diversification. Many industries entered by the company are very different from its own main industry, which makes it difficult for the company to maintain professionalism and focus. The failure in unfamiliar industries will have a negative impact on the brand value of the company (Sparks, 2019).
One of the major strategies of Sainsbury’s is the operation of convenience stores, which expand the company’s business through convenience stores in order to meet the daily needs of more customers. The company provides a wealth of product types, while implementing a low-cost strategy, which makes the company’s customers have a high degree of loyalty.
The company’s matching promotion and coupons ensure that the company’s product price has a great competitive advantage. Matching promotion refers to the comparison of the price of goods sold by the company with that of competitors, so as to maintain the price advantage of the product (Bentham, 2018). But the company’s convenience stores are facing fierce competition, which is also the reason why the company’s business growth is not fast enough.
As a special online retailer,
Ocado has strong software and platform technology. Through this platform, the company can make corresponding plans according to the requirements of partners, and at the same time, it can collect a large number of consumer information, so as to better understand the changes in consumer demand.
In addition, Ocado is constantly updating the scope of its own brand, taking advantage of its brand in the network to launch a series of new brand products, become the driving force of the company’s growth. One of the important strategies of Ocado is competitive pricing strategy. The products sold by the company match the prices of other physical retailers, and if consumers find that they have bought more expensive goods, the company will refund the price difference to the consumers (Mason, 2019).
Financial analysis
Trend analysis
As is shown in Table 1, the revenue of Tesco had a large decline in 2016, which was mainly due to poor sales in Central Europe, as a result, the company sold its business in Turkey in 2017 and the revenue began to grow because the company was more focused on familiar markets. The revenue of Tesco grew sharply in 2019 with 11.17% growth rate, which mainly due to the acquisition of Booker, a local food wholesaler in the UK.
The acquisition has brought about a significant increase in the company’s sales in the UK. The company’s operating income has been growing for nearly three years, mainly because the cost control within the company is very effective, and the management cost has not changed much in the case of revenue growth. The company’s net income remained high in 2018 and 2019, with a growth rate of 9.62% in 2019. The company’s net income in 2017 was negative, mainly affected by joint ventures.
Table 1 Tesco trend analysis
Tesco 2019-02 2018-02 2017-02 2016-02 2015-02
Revenue 63,911 57,491 55,917 54,433 62,284
YOY 11.17% 2.81% 2.73% -12.61% -2%
Operating Income 2,077 1,564 1,168 980 -4,807
Operating Margin 3.2% 2.7% 2.1% 1.8% -7.7%
YOY 32.88% 33.9% 19.18% – –
Net income 1,322 1,206 -40 138 -5,741
YOY 9.62% – – – –
EPS 0.41 0.44 -0.01 0.05 -2.12
YOY -7.95% – – – –
As is shown in Table 2, the revenue of Sainsbury’s grew negatively in 2015 and 2016 compared with the previous year, but saw a relatively large positive growth rate of 11.56% in 2017, which mainly due to the acquisition of subsidiaries by the company in 2016-2017, such as Argos. Subsequently, as the acquisition effect weakened, the company’s revenue growth slowed down in 2018 and 2019.
The operating income of the company has been declining year by year since 2016. Although the acquisition has brought about an increase in revenue, it has also greatly increased the management costs of the company. The net income of the company has also shown a decreasing trend year by year in the past three years, because the other income of the company decreased year by year, especially the financial income was down £100m in 2019.Report on the performance案例
Table 2 Sainsbury’s trend analysis
Sainsbury’s 2019-03 2018-03 2017-03 2016-03 2015-03
Revenue 29,007 28,456 26,224 23,506 23,775
YOY 1.94% 8.51% 11.56% -1.13% -0.73%
Operating Income 312 518 642 707 81
Operating Margin 1.1% 1.8% 2.4% 3% 0.3%
YOY -39.77% -19.13% -9.19% 772.84% -91.97%-
Net income 219 309 377 471 -166
YOY -29.13% -18.04% -19.96% – –
EPS 0.08 0.13 0.17 0.23 -0.08
YOY -29.92% -23.03% -26.67% – –
As is shown in Table 3, the revenue of Ocado has been growing for the last five years, mainly because the company attracted new consumers by constantly enriching the variety of its online retail products, but the growth trend has slowed, as over time the company’s development has gradually matured and the variety of goods has become complete.
The company’s operating income has been at a very low level, because the company’s management cost has been high, especially in 2018, the company’s operating income was negative, because the company’s management costs appeared to rise significantly. The proportion of other income and expenses of the company was relatively small, so the net income of the company basically maintained the same trend as the operating income.
Table 3 Ocado trend analysis Report on the performance案例
Ocado 2018–11 2017–11 2016–11 2015–11 2014–11
Revenue 1,598 1,463 1,271 1,107 948
YOY 9.22% 15.17% 14.75% 16.72% 19.8%
Operating Income -46 1 7 5 2
Operating Margin -2.9% – 0.6% 0.5% 0.3%
YOY – -93.42% 40.74% 92.86% 180%-
Net income -44 1 12 12 7
YOY – -91.67% 1.69% 61.64% –
EPS -0.07 -0.01 0.02 0.02 0.01
YOY – -91.84% 2.62% 61.86% –
Ratios analysis Report on the performance案例
Profitability ratios
As can be seen from Table 4, Ocado has the highest gross profit margin, because Ocado only has online sales, its sales cost control is the best, and its gross profit margin is relatively stable in the last three years. The gross profit margin of Tesco and Sainsbury’s is relatively similar, the gross profit margin level has increased slightly in the last three years, and both companies have entered the mature period, with the sales growth in the last three years, the control of sales cost has improved slightly.
Tesco’s profit margin has the best performance, the company profit margin has been improving in the past three years, because the company’s management costs are best controlled. The profit margin of Sainsbury’s shows a downward trend in the past three years mainly because of the decline in other income levels of the company. Ocado’s profit margin is the worst performance, because the company’s management costs are very high, in the last year the profit margin was negative. Tesco’s net profit growth rate in the past three years was faster than that of asset investment, which makes the company’s ROA, ROCE and ROSF the highest among the three companies, and shows an upward trend. The ROA, ROCE and ROSF of Sainsbury’s and Ocado showed a downward trend, mainly due to the decline in net profit.
Table 4 Profitability ratios analysis
Ratios Tesco Sainsbury’s Ocado
2019-02 2018-02 2017-02 2019-03 2018-03 2017-03 2018-11 2017-11 2016-11
ROSF 11.27 12.39 2.25 3.08 5.52 7.32 -7.98 0.37 4.61
ROCE 5.9 5.07 0.55 2.34 3.5 4.51 -4.35 0.16 2.95
ROA 3.41 2.89 0.32 1.15 1.86 2.55 -3.29 0.11 1.73
Profit margin 2.62 2.26 0.26 0.82 1.44 1.92 -2.78 0.07 0.95
Gross margin 6.48 5.83 5.19 6.92 6.61 6.23 34.24 34.45 34.25
Operational ratiosReport on the performance案例
As can be seen from Table 5, Ocado had a large number of new investments each year as a result of the development phase (Schleimer, 2018). Although the company’s sales revenue maintained growth, net assets turnover and fixed assets turnover both showed a downward trend. The revenue of Sainsbury’s has been growing in the last three years, plus no substantial investment in fixed assets, net assets turnover and fixed assets turnover of Sainsbury’s both showed a upward trend.
Tesco’s fixed assets turnover fell in 2019 mainly because of the large increase in fixed asset investment, but the level of total asset investment did not increase much, so the company’s net assets yurnover rose slightly. The debtors turnover of the three companies is very different, mainly because the credit sales of Sainsbury’s account for a large proportion, while the proportion of accounts receivable of Tesco is very low, and Ocado is in the middle level, and the credit sales of the company also account for a certain proportion.
Table 5 Operational ratios analysis Report on the performance案例
Ratios Tesco Sainsbury’s Ocado
2018 2017 2016 2018 2017 2016 2018 2017 2016
Net Assets Turnover 2.25 2.24 2.11 2.83 2.43 2.35 1.57 2.30 3.10
Fixed Assets Turnover 1.76 1.85 1.84 2.11 2.01 1.95 2.07 2.31 2.31
Debtors Turnover 106.87 123.37 114.12 8.37 8.18 9.39 30.51 52.09 55.26
Liquidity ratios Report on the performance案例
Tesco’s current ratio and quick ratio are the lowest, and there is a downward trend in the past three years, as Tesco does not like to hold a large amount of cash and stock, and the company’s bank deposits have fallen sharply in 2019. The current ratio and liquidity ratio of Sainsbury’s are also relatively low, and the trend of decline in the last three years is mainly due not to the decline of the company’s current assets, but to the increase of the company’s current liabilities, and the company’s credit sales and bank loans have increased significantly in 2019. Ocado’s current ratio and quick ratio have been significantly improved in the last three years, mainly due to a sharp increase in current assets amid a small increase in corporate current liabilities, especially a sharp increase in the company’s bank deposits in 2019.
Table 6 Liquidity ratios analysis
Ratios Tesco Sainsbury’s Ocado
2018 2017 2016 2018 2017 2016 2018 2017 2016
Current ratio 0.61 0.71 0.79 0.66 0.76 0.74 1.75 1.01 0.51
Quick ratio 0.49 0.6 0.68 0.5 0.59 0.53 1.58 0.84 0.38
Solvency ratios
As can be seen from Table 7, Tesco’s solvency has improved significantly in the last three years, mainly because the company has repaid some of its debt and its investment in international stores has declined, resulting in a significant decline in leverage. But compared with the other two companies, Tesco still has the greatest debt pressure. Report on the performance案例
The solvency of Sainsbury’s declined slightly in 2017 and rose above its 2016 level in 2018, largely because of the growing stockholders funds, which results a sharp drop in leverage in 2019. Of the three companies, Sainsbury’s has the best solvency. The solvency of Ocado is next to Sainsbury’s, and the company’s solvency has been improved in 2018, mainly because the company has paid a large part of its debt, while the company’s leverage has also fallen sharply. In these three companies, the debt structure of the Sainsbury’s is the most reasonable (Guo & Wang, 2019).
Table 7 Solvency ratios analysis
Ratios Tesco Sainsbury’s Ocado
2018 2017 2016 2018 2017 2016 2018 2017 2016
Solvency ratio (Asset based) 30.29 23.36 14.04 37.45 33.68 34.82 41.23 30.26 37.45
Gearing 161.26 233.35 454.71 43.25 68.16 66.72 87.48 145.47 87.65
Conclusion Report on the performance案例
To conclude, through an analysis of the UK retail market, as well as non-financial and financial analysis of the three companies, the report finds that Tesco is more valuable for investment. First of all, from the market, Tesco occupies the highest market share, the brand value in the market is very high, because the physical sales are affected by online sales, Tesco also began to develop online sales business, although there is still a gap with Ocado in this field, but the company’s market influence is very conducive to the expansion of the online sales.
From the point of view of non-financial analysis, Tesco’s diversification strategy and globalization strategy are the most successful, and the company’s online sales are also expanding, while Sainsbury’s ‘s convenience store strategy has been strongly impacted by competitors, and Ocado’s advantages are mainly concentrated in online shopping, lack of physical store support.Report on the performance案例
Financially, Tesco has grown better than the other two companies in recent years and has the strongest profitability. Ocado has a high gross margin, but its net profit margin is very low. Tesco financial performance is not prominent in terms of operating efficiency, liquidity and solvency, but this is related to the level of fixed asset investment and the reluctance to hold too much cash and stocks. As a result, Tesco generally performed better and is more worth investing in.
Reference
Bentham, J. (2018). Business and Economics in the News–Sainsbury’s and Asda-the decade’s mega-merger. Teaching Business & Economics, 22(3), 11-12.
Dimitrova, B. V., Smith, B., & Kim, S. (2018). Performance implications of store format diversification for international retailers. Journal of Marketing Channels, 25(3), 117-136.
Guo, L., & Wang, Z. (2019). Ratio Analysis of J Sainsbury plc Financial Performance between 2015 and 2018 in Comparison with Tesco and Morrisons. American Journal of Industrial and Business Management, 9(1), 325-341.
Humphries, C. (2019). Retail sales, Great Britain: September 2019. Office for National Statistics.
Mason, R. (2019). Developing a Profitable Online Grocery Logistics Business: Exploring Innovations in Ordering, Fulfilment, and Distribution at Ocado. In Contemporary Operations and Logistics (pp. 365-383). Palgrave Macmillan, Cham.
Ocado. (2018). Annual Report 2019. Available at:
https://www.ocadogroup.com/investors/reports-and-presentations/2019.aspx
Rhodes, C. (2018). Retail sector in the UK. House of commons library.
Rhodes, C. (2019). Retail sales. House of commons library.
Sainsbury’s. (2019). Annual Report 2019. Available at:
https://www.about.sainsburys.co.uk/investors/annual-report-2019
Schleimer, S. (2018). Accounting and Financial Analysis of UK Supermarkets. GRIN Verlag.
Sparks, L. (2019). Tesco: how supply chain strategy supports retail success. The Business & Management Collection.
Tesco. (2019). Annual Report 2019. Available at:
https://www.tescoplc.com/investors/reports-results-and-presentations/annual-report-2019/
Worldatlas. (2019). The Largest Supermarket Chains In The United Kingdom. Available at:
https://www.worldatlas.com/articles/the-largest-supermarket-chains-in-the-united-kingdom.html
Report on the performance案例Report on the performance案例
Report on the performance of Tesco, Sainsbury’s and Ocado
Report on the performance案例Report on the performance案例
Report on the performance案例 The retail industry in UK is in a volatile transition. The change of consumer behavior and the increase
Industry and company background
The retail industry in UK is in a volatile transition. The change of consumer behavior and the increase of online shopping are changing the operating mode of the industry. Sales in the UK retail industry in 2017 were £395 billion, with a gross added value of £92.8 billion. In 2018, the total volume of retail sales in the UK was 319,000 (Rhodes, 2018). Report on the performance案例
As Figure 1 shows, gross value added growth in the UK retail industry has slowed in the past three years, with a certain rebound near zero. As Figure 2 shows, every three months growth rate of the volume of retail sales in the UK has fluctuated back and forth between -2 percent and 2 percent starting in 2016 (Rhodes, 2019). The fluctuation of the retail industry is mainly due to the fluctuation of the economy, and the rise of the online shopping has also caused an impact on the retail chain.
Figure 1 Gross value added growth in the UK retail industry
Figure 2 3 mths growth rate of the volume in the UK retail industry
Report on the performance案例Report on the performance案例
Compared with the turmoil in retail chains, online retailing has maintained a growth trend for more than a decade. In 2018, the proportion of online sales in total sales exceeded 20 percent for the first time, see Figure 3. The growth in online sales has dealt a blow to retail chains, with as many as 28 retail companies closed in 2018 and 2,085 stores were affected, which is the largest number in recent years, see Figure 4 (Humphries, 2019).
Figure 3 The proportion of online sales in the UK
Figure 4 Retail companies closed in the UK
Report on the performance案例Report on the performance案例
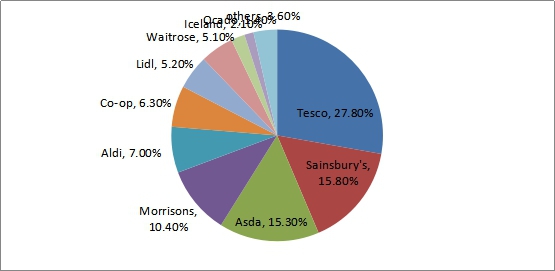
The market share of the UK retail industry in 2018 is shown in Figure 5, and all three companies selected in the report come from the top 10 companies, namely Tesco, Sainsbury’s and Ocado. Among them, Tesco and Sainsbury’s are the top two companies in market share, while Ocado is a dedicated online retailer (Worldatlas, 2019).
Figure 5 The market share of the UK retail industry
Tesco was founded in 1919, with its headquarters in Hertford, which is the largest supermarket chain in the UK, with a market share of 27.8 percent in 2018. Tesco has now evolved into a large multinational, with its operations in 12 countries in Asia and Europe. Tesco employs about 450,000 people, has 6,800 offices and earns £639 billion. Tesco is listed on the London Stock Exchange and is a component of the FTSE 100 (Tesco, 2019).
Sainsbury’s is an older supermarket chain founded in London in 1869. For a long time, it was the largest retailer in the UK until it was overtaken by Tesco in 1995. Sainsbury’s had a market share of 15.8 percent in 2018, which is the UK’s second-largest supermarket chain only behind Tesco. Sainsbury’s has approximately 186,900 employees and 1,415 duty stations. Sainsbury’s is listed on the London Stock Exchange and is a component of the FTSE 100.
Ocado, by contrast, is a young company founded in 2000. Unlike Tesco and Sainsbury’s, Ocado does not have traditional physical retail stores, which is a complete online supermarket. Ocado’s market share was 1.4 percent in 2018, ranking tenth in the industry. Ocado is listed on the London Stock Exchange and is a component of the FTSE 100 (Ocado, 2018).
Non-financial analysis Report on the performance案例
Diversification and globalization strategy have brought strong impetus to the growth of Tesco. At present, in addition to retail chains, the company is also engaged in finance, gasoline, clothing and other businesses. Diversified business strategy has improved the company’s ability to deal with risks. At the same time, the company has expanded its business to more than 12 countries, which is conducive to the company’s continuous access to new markets (Dimitrova, Smith & Kim, 2018).
Tesco has also set up online stores in the trend of online shopping.
The development direction of e-commerce also ensures that the company will not be affected by the loss of physical store consumers. The company also provides club cards to consumers, which helps to improve consumer loyalty, and to have a more comprehensive understanding of consumer needs by collecting consumer shopping information.
Tesco also attaches great importance to the social image, who advocates reducing the use of plastic bags in order to protect the environment, and promises to achieve zero carbon emissions by 2050, which is very important for the company to establish a good image among consumers. The problem that Tesco should pay attention to is the influence of excessive diversification. Many industries entered by the company are very different from its own main industry, which makes it difficult for the company to maintain professionalism and focus. The failure in unfamiliar industries will have a negative impact on the brand value of the company (Sparks, 2019).
One of the major strategies of Sainsbury’s is the operation of convenience stores, which expand the company’s business through convenience stores in order to meet the daily needs of more customers. The company provides a wealth of product types, while implementing a low-cost strategy, which makes the company’s customers have a high degree of loyalty.
The company’s matching promotion and coupons ensure that the company’s product price has a great competitive advantage. Matching promotion refers to the comparison of the price of goods sold by the company with that of competitors, so as to maintain the price advantage of the product (Bentham, 2018). But the company’s convenience stores are facing fierce competition, which is also the reason why the company’s business growth is not fast enough.
As a special online retailer,
Ocado has strong software and platform technology. Through this platform, the company can make corresponding plans according to the requirements of partners, and at the same time, it can collect a large number of consumer information, so as to better understand the changes in consumer demand.
In addition, Ocado is constantly updating the scope of its own brand, taking advantage of its brand in the network to launch a series of new brand products, become the driving force of the company’s growth. One of the important strategies of Ocado is competitive pricing strategy. The products sold by the company match the prices of other physical retailers, and if consumers find that they have bought more expensive goods, the company will refund the price difference to the consumers (Mason, 2019).
Financial analysis
Trend analysis
As is shown in Table 1, the revenue of Tesco had a large decline in 2016, which was mainly due to poor sales in Central Europe, as a result, the company sold its business in Turkey in 2017 and the revenue began to grow because the company was more focused on familiar markets. The revenue of Tesco grew sharply in 2019 with 11.17% growth rate, which mainly due to the acquisition of Booker, a local food wholesaler in the UK.
The acquisition has brought about a significant increase in the company’s sales in the UK. The company’s operating income has been growing for nearly three years, mainly because the cost control within the company is very effective, and the management cost has not changed much in the case of revenue growth. The company’s net income remained high in 2018 and 2019, with a growth rate of 9.62% in 2019. The company’s net income in 2017 was negative, mainly affected by joint ventures.
Table 1 Tesco trend analysis
Tesco 2019-02 2018-02 2017-02 2016-02 2015-02
Revenue 63,911 57,491 55,917 54,433 62,284
YOY 11.17% 2.81% 2.73% -12.61% -2%
Operating Income 2,077 1,564 1,168 980 -4,807
Operating Margin 3.2% 2.7% 2.1% 1.8% -7.7%
YOY 32.88% 33.9% 19.18% – –
Net income 1,322 1,206 -40 138 -5,741
YOY 9.62% – – – –
EPS 0.41 0.44 -0.01 0.05 -2.12
YOY -7.95% – – – –
As is shown in Table 2, the revenue of Sainsbury’s grew negatively in 2015 and 2016 compared with the previous year, but saw a relatively large positive growth rate of 11.56% in 2017, which mainly due to the acquisition of subsidiaries by the company in 2016-2017, such as Argos. Subsequently, as the acquisition effect weakened, the company’s revenue growth slowed down in 2018 and 2019.
The operating income of the company has been declining year by year since 2016. Although the acquisition has brought about an increase in revenue, it has also greatly increased the management costs of the company. The net income of the company has also shown a decreasing trend year by year in the past three years, because the other income of the company decreased year by year, especially the financial income was down £100m in 2019.Report on the performance案例
Table 2 Sainsbury’s trend analysis
Sainsbury’s 2019-03 2018-03 2017-03 2016-03 2015-03
Revenue 29,007 28,456 26,224 23,506 23,775
YOY 1.94% 8.51% 11.56% -1.13% -0.73%
Operating Income 312 518 642 707 81
Operating Margin 1.1% 1.8% 2.4% 3% 0.3%
YOY -39.77% -19.13% -9.19% 772.84% -91.97%-
Net income 219 309 377 471 -166
YOY -29.13% -18.04% -19.96% – –
EPS 0.08 0.13 0.17 0.23 -0.08
YOY -29.92% -23.03% -26.67% – –
As is shown in Table 3, the revenue of Ocado has been growing for the last five years, mainly because the company attracted new consumers by constantly enriching the variety of its online retail products, but the growth trend has slowed, as over time the company’s development has gradually matured and the variety of goods has become complete.
The company’s operating income has been at a very low level, because the company’s management cost has been high, especially in 2018, the company’s operating income was negative, because the company’s management costs appeared to rise significantly. The proportion of other income and expenses of the company was relatively small, so the net income of the company basically maintained the same trend as the operating income.
Table 3 Ocado trend analysis Report on the performance案例
Ocado 2018–11 2017–11 2016–11 2015–11 2014–11
Revenue 1,598 1,463 1,271 1,107 948
YOY 9.22% 15.17% 14.75% 16.72% 19.8%
Operating Income -46 1 7 5 2
Operating Margin -2.9% – 0.6% 0.5% 0.3%
YOY – -93.42% 40.74% 92.86% 180%-
Net income -44 1 12 12 7
YOY – -91.67% 1.69% 61.64% –
EPS -0.07 -0.01 0.02 0.02 0.01
YOY – -91.84% 2.62% 61.86% –
Ratios analysis Report on the performance案例
Profitability ratios
As can be seen from Table 4, Ocado has the highest gross profit margin, because Ocado only has online sales, its sales cost control is the best, and its gross profit margin is relatively stable in the last three years. The gross profit margin of Tesco and Sainsbury’s is relatively similar, the gross profit margin level has increased slightly in the last three years, and both companies have entered the mature period, with the sales growth in the last three years, the control of sales cost has improved slightly.
Tesco’s profit margin has the best performance, the company profit margin has been improving in the past three years, because the company’s management costs are best controlled. The profit margin of Sainsbury’s shows a downward trend in the past three years mainly because of the decline in other income levels of the company. Ocado’s profit margin is the worst performance, because the company’s management costs are very high, in the last year the profit margin was negative. Tesco’s net profit growth rate in the past three years was faster than that of asset investment, which makes the company’s ROA, ROCE and ROSF the highest among the three companies, and shows an upward trend. The ROA, ROCE and ROSF of Sainsbury’s and Ocado showed a downward trend, mainly due to the decline in net profit.
Table 4 Profitability ratios analysis
Ratios Tesco Sainsbury’s Ocado
2019-02 2018-02 2017-02 2019-03 2018-03 2017-03 2018-11 2017-11 2016-11
ROSF 11.27 12.39 2.25 3.08 5.52 7.32 -7.98 0.37 4.61
ROCE 5.9 5.07 0.55 2.34 3.5 4.51 -4.35 0.16 2.95
ROA 3.41 2.89 0.32 1.15 1.86 2.55 -3.29 0.11 1.73
Profit margin 2.62 2.26 0.26 0.82 1.44 1.92 -2.78 0.07 0.95
Gross margin 6.48 5.83 5.19 6.92 6.61 6.23 34.24 34.45 34.25
Operational ratiosReport on the performance案例
As can be seen from Table 5, Ocado had a large number of new investments each year as a result of the development phase (Schleimer, 2018). Although the company’s sales revenue maintained growth, net assets turnover and fixed assets turnover both showed a downward trend. The revenue of Sainsbury’s has been growing in the last three years, plus no substantial investment in fixed assets, net assets turnover and fixed assets turnover of Sainsbury’s both showed a upward trend.
Tesco’s fixed assets turnover fell in 2019 mainly because of the large increase in fixed asset investment, but the level of total asset investment did not increase much, so the company’s net assets yurnover rose slightly. The debtors turnover of the three companies is very different, mainly because the credit sales of Sainsbury’s account for a large proportion, while the proportion of accounts receivable of Tesco is very low, and Ocado is in the middle level, and the credit sales of the company also account for a certain proportion.
Table 5 Operational ratios analysis Report on the performance案例
Ratios Tesco Sainsbury’s Ocado
2018 2017 2016 2018 2017 2016 2018 2017 2016
Net Assets Turnover 2.25 2.24 2.11 2.83 2.43 2.35 1.57 2.30 3.10
Fixed Assets Turnover 1.76 1.85 1.84 2.11 2.01 1.95 2.07 2.31 2.31
Debtors Turnover 106.87 123.37 114.12 8.37 8.18 9.39 30.51 52.09 55.26
Liquidity ratios Report on the performance案例
Tesco’s current ratio and quick ratio are the lowest, and there is a downward trend in the past three years, as Tesco does not like to hold a large amount of cash and stock, and the company’s bank deposits have fallen sharply in 2019. The current ratio and liquidity ratio of Sainsbury’s are also relatively low, and the trend of decline in the last three years is mainly due not to the decline of the company’s current assets, but to the increase of the company’s current liabilities, and the company’s credit sales and bank loans have increased significantly in 2019. Ocado’s current ratio and quick ratio have been significantly improved in the last three years, mainly due to a sharp increase in current assets amid a small increase in corporate current liabilities, especially a sharp increase in the company’s bank deposits in 2019.
Table 6 Liquidity ratios analysis
Ratios Tesco Sainsbury’s Ocado
2018 2017 2016 2018 2017 2016 2018 2017 2016
Current ratio 0.61 0.71 0.79 0.66 0.76 0.74 1.75 1.01 0.51
Quick ratio 0.49 0.6 0.68 0.5 0.59 0.53 1.58 0.84 0.38
Solvency ratios
As can be seen from Table 7, Tesco’s solvency has improved significantly in the last three years, mainly because the company has repaid some of its debt and its investment in international stores has declined, resulting in a significant decline in leverage. But compared with the other two companies, Tesco still has the greatest debt pressure. Report on the performance案例
The solvency of Sainsbury’s declined slightly in 2017 and rose above its 2016 level in 2018, largely because of the growing stockholders funds, which results a sharp drop in leverage in 2019. Of the three companies, Sainsbury’s has the best solvency. The solvency of Ocado is next to Sainsbury’s, and the company’s solvency has been improved in 2018, mainly because the company has paid a large part of its debt, while the company’s leverage has also fallen sharply. In these three companies, the debt structure of the Sainsbury’s is the most reasonable (Guo & Wang, 2019).
Table 7 Solvency ratios analysis
Ratios Tesco Sainsbury’s Ocado
2018 2017 2016 2018 2017 2016 2018 2017 2016
Solvency ratio (Asset based) 30.29 23.36 14.04 37.45 33.68 34.82 41.23 30.26 37.45
Gearing 161.26 233.35 454.71 43.25 68.16 66.72 87.48 145.47 87.65
Conclusion Report on the performance案例
To conclude, through an analysis of the UK retail market, as well as non-financial and financial analysis of the three companies, the report finds that Tesco is more valuable for investment. First of all, from the market, Tesco occupies the highest market share, the brand value in the market is very high, because the physical sales are affected by online sales, Tesco also began to develop online sales business, although there is still a gap with Ocado in this field, but the company’s market influence is very conducive to the expansion of the online sales.
From the point of view of non-financial analysis, Tesco’s diversification strategy and globalization strategy are the most successful, and the company’s online sales are also expanding, while Sainsbury’s ‘s convenience store strategy has been strongly impacted by competitors, and Ocado’s advantages are mainly concentrated in online shopping, lack of physical store support.Report on the performance案例
Financially, Tesco has grown better than the other two companies in recent years and has the strongest profitability. Ocado has a high gross margin, but its net profit margin is very low. Tesco financial performance is not prominent in terms of operating efficiency, liquidity and solvency, but this is related to the level of fixed asset investment and the reluctance to hold too much cash and stocks. As a result, Tesco generally performed better and is more worth investing in.
Reference
Bentham, J. (2018). Business and Economics in the News–Sainsbury’s and Asda-the decade’s mega-merger. Teaching Business & Economics, 22(3), 11-12.
Dimitrova, B. V., Smith, B., & Kim, S. (2018). Performance implications of store format diversification for international retailers. Journal of Marketing Channels, 25(3), 117-136.
Guo, L., & Wang, Z. (2019). Ratio Analysis of J Sainsbury plc Financial Performance between 2015 and 2018 in Comparison with Tesco and Morrisons. American Journal of Industrial and Business Management, 9(1), 325-341.
Humphries, C. (2019). Retail sales, Great Britain: September 2019. Office for National Statistics.
Mason, R. (2019). Developing a Profitable Online Grocery Logistics Business: Exploring Innovations in Ordering, Fulfilment, and Distribution at Ocado. In Contemporary Operations and Logistics (pp. 365-383). Palgrave Macmillan, Cham.
Ocado. (2018). Annual Report 2019. Available at:
https://www.ocadogroup.com/investors/reports-and-presentations/2019.aspx
Rhodes, C. (2018). Retail sector in the UK. House of commons library.
Rhodes, C. (2019). Retail sales. House of commons library.
Sainsbury’s. (2019). Annual Report 2019. Available at:
https://www.about.sainsburys.co.uk/investors/annual-report-2019
Schleimer, S. (2018). Accounting and Financial Analysis of UK Supermarkets. GRIN Verlag.
Sparks, L. (2019). Tesco: how supply chain strategy supports retail success. The Business & Management Collection.
Tesco. (2019). Annual Report 2019. Available at:
https://www.tescoplc.com/investors/reports-results-and-presentations/annual-report-2019/
Worldatlas. (2019). The Largest Supermarket Chains In The United Kingdom. Available at:
https://www.worldatlas.com/articles/the-largest-supermarket-chains-in-the-united-kingdom.html
Report on the performance案例Report on the performance案例