用R阐明和描绘Facebook的“liked”和伴侣网络
Wednesday, January 18, 2012
Mining FacebookData: Most “Liked” Status and Friendship Network
Professional R Enthusiast published a quick manual how to use Facebook Graph API. I particularly like atrick to obtain an access-token using Graph API Explorer.
Now, you can easily employ R to get your most”Liked” Facebook status ever. For me it was this photo followed by a lot of posts about my kids. The same codecan be applied to Facebook Group or Page. For example the most popular videos,that appeared on TED Page last year, were the following:
See the code, it is not so long.
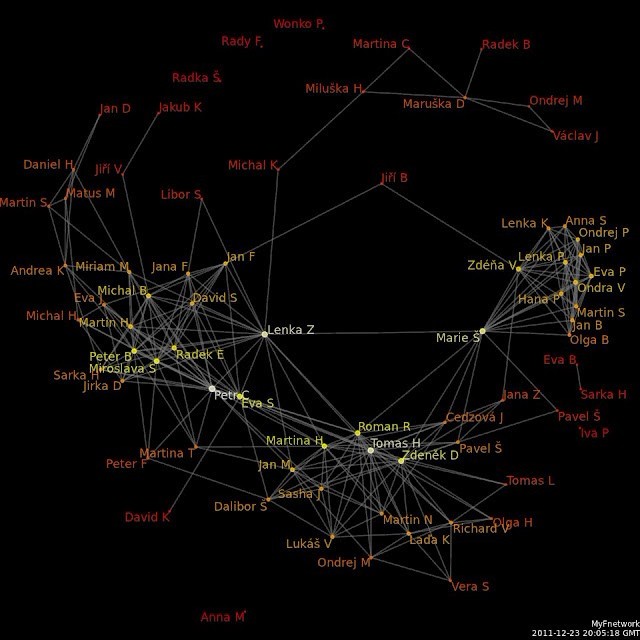
Now let us try something more sophisticated.Before Xmas a lot of my friends tested MyFnetwork app to visualize their friendship networks(see my network below). Surely, this is not the first app doing this. However,this might be the first one really useful. I can see groups of my friendsseparated (colleagues vs. friends of my wife vs. high schoolclassmates vs. university classmates). Highlighting tries toemphasize the key persons in each group but unfortunately it misses anadjustment for total number of friends (Facebook enthusiasts like PetrC orLenkaZ seem to be more special than they really are).

|
Original myFnetwork graph
|
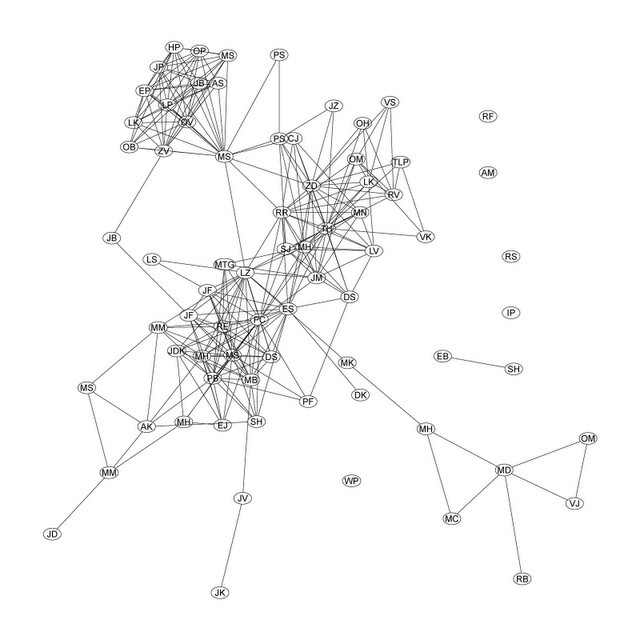
So how difficult would it be to produce a similar graphwith R? Actually, as you can see it is just a few lines of code. First Iscraped the list of friends, then for each of them I got the list of mutualfriends and finally Rgraphviz package does the plotting stuff.

|
R/Graphviz plot with initials
|
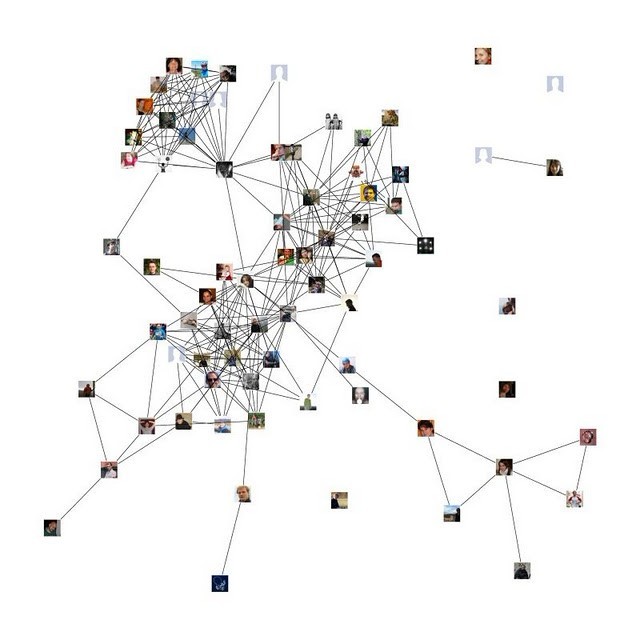
As you can see the graphs are pretty similar (most likely,MyFnetwork also uses some port of Graphviz code). Of course, there existsendless list of modifications. For example, you can first download friends’profile pictures and then use custom node plotting function to producesomething like the following:

|
R/Graphviz plot with profile pictures
|
Now you can guess who is my wife and who is the problematic friend from the previous post
关键字:
